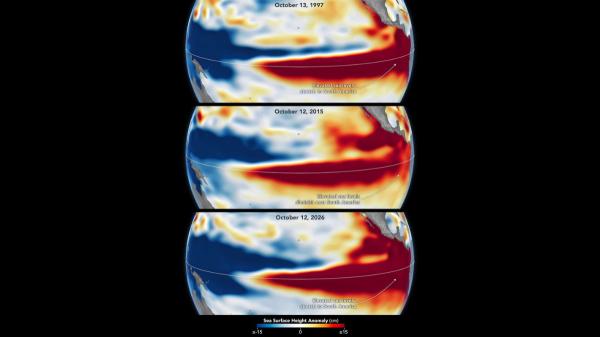
Satellite images allow us to observe how El Niño is evolving in the Pacific Ocean and compare it with some of the most intense episodes recorded. NASA has put two maps face to face, separated by almost 29 years: one from October 13, 1997, and another from October 12, 2026. The similarity between the two has caught the attention of researchers.
The two images show an extensive area of water with a higher height than usual in the central and eastern equatorial Pacific, which extends to the coasts of South America. This pattern is one of the characteristic signs of El Niño and is reminiscent of the one observed during the 1997-1998 episode, considered one of the most intense in modern records.
The comparison does not mean that both episodes will have exactly the same consequences. However, the data allow us to study how heat is distributed in the ocean and help scientists estimate what could happen in the coming months, in a context in which the phenomenon is expected to continue to intensify.
NASA images show a pattern similar to that of 1997
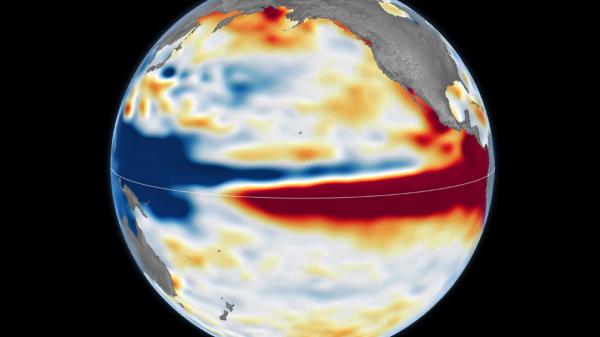
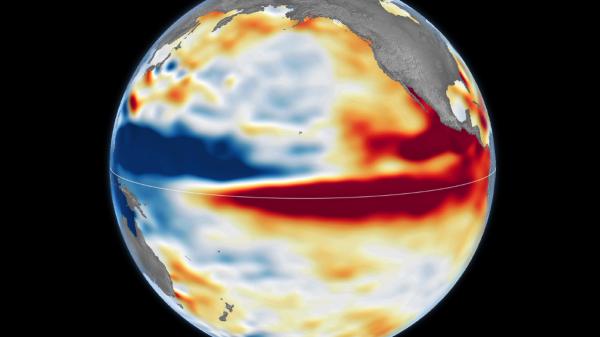
The comparison published by NASA’s Earth Observatory uses satellite altimetry data to show anomalies in sea surface height. On the October 2026 map, red areas indicate that the ocean level is above average, while blue shades represent areas that are lower than usual.
The phenomenon also appears in the October 1997 image, taken during one of the most intense El Niño episodes. In both cases, the highest water extends across the central and eastern Pacific and reaches the South American coast. This distribution constitutes an important clue about the accumulation of heat in the ocean.
To make the comparison, the researchers have used two different satellite missions. The 1997 image is based on data from the TOPEX/Poseidon satellite, while the 2026 image uses measurements from Sentinel-6 Michael Freilich.
The continuity of these observations allows us to have a record of about 35 years, with which scientists can study the evolution of the ocean surface and compare episodes separated by decades. According to Josh Willis, a researcher at NASA’s Jet Propulsion Laboratory (JPL), the current phenomenon is following an evolution that could lead it to surpass some of its most intense precedents.
However, the researcher himself warns that there is no single pattern for all El Niño episodes. The position of warmer waters and the response of the atmosphere can vary and, with them, so do their effects on the climate.
What ocean height anomalies reveal
El Niño is a natural climate phenomenon that occurs irregularly, approximately every two to seven years. It is characterized by an anomalous warming of the surface waters of the central and eastern equatorial Pacific and by changes in atmospheric circulation that can modify rainfall and temperature patterns in different regions of the planet.
NASA images allow us to understand one of the signals that help identify it. When sea water warms, it expands and takes up more volume. Therefore, areas with warmer waters may be higher than usual. Differences in level also reflect how water is distributed between different parts of the ocean.
The process is related to the trade winds, which normally push warm surface waters towards the western Pacific, towards Asia and Oceania. When these winds weaken, part of that warm water moves eastward, which favors a new increase in temperature and contributes to altering atmospheric circulation.
This mechanism of interaction between the ocean and the atmosphere can be reinforced as the episode progresses. Therefore, scientists combine sea height measurements with temperature, wind and precipitation data to follow its evolution.
NASA has also compared the current episode with that of 2015-2016, another of the most intense in recent decades. However, in that case the ocean height anomalies did not extend to the South American coast in the same way as in 1997 and 2026. That difference helps explain why two strong El Niño events do not have to generate the same weather patterns.
El Niño could intensify in the coming months
Forecasts indicate that the current episode will continue to strengthen. In its report of October 8, 2026, the United States National Oceanic and Atmospheric Administration (NOAA) estimated that there was more than an 83% probability that El Niño would reach strong or very strong intensity during the period until January-March 2027.
NASA also includes these forecasts in its analysis and highlights that the 2026 phenomenon has developed more suddenly than that of 1997-1998. Although the images show similarities between the two, it is still necessary to observe how the interaction between the ocean and the atmosphere evolves to determine the extent of its effects.
The World Meteorological Organization, for its part, has warned that the strengthening of El Niño can alter temperatures and precipitation in different parts of the world. Among the associated risks are heavy rains, floods, droughts and extreme heat episodes, although their probability and distribution depend on each region and the time of year.
These changes do not affect all territories equally. El Niño may favor abundant rainfall in some areas and drier conditions in others, while additional climatic factors may modify the usual response. Therefore, the intensity of the phenomenon alone does not allow us to accurately anticipate what the weather will be like in each country.
The images compared by NASA ultimately offer a visual reference to understand the magnitude that the current episode could reach. The similarity with October 1997 is a relevant signal for researchers, but upcoming ocean measurements and meteorological observations will be essential to verify how El Niño evolves and what consequences it ends up having during the winter of 2026-2027.
If you want to read more articles similar to NASA compares the El Niño of 2026 with that of 1997: the images show a phenomenon that could be historic, we recommend that you enter our Meteorological Phenomena category.