The Beaufort scale is a system used to measure the strength of the wind from its visible effects both on land and at sea. Developed in the 19th century by the British admiral Francis Beaufort, this scale allows the wind to be classified into different levels, from 0 to 12, according to its intensity and the conditions it generates in the environment.
In this Evidence Network article we are going to tell you what the Beaufort scale is, what it is for and what its table is like, as well as its operation and its difference with the anemometer.
What is the Beaufort scale and what does it measure?
The Beaufort scale is a tool used to measure the strength of the wind according to its visible effects, both on the sea surface and on land. It was created at the beginning of the 19th century by British admiral Francis Beaufort, with the aim that sailors could more accurately describe wind conditions without the need for instruments.
This scale goes from 0 to 12, where each number represents a range of wind speed and the effects it produces. For example, level 0 corresponds to a complete calm, with the sea smooth as a mirror and smoke rising vertically, while level 12 describes a hurricane, with extremely strong winds that can cause severe damage.
We recommend you read this other post about Wind: what it is, types, when it is strong, how it is measured and examples.
What is the Beaufort scale for?
The Beaufort scale serves mainly to describe the intensity of the wind in a clear and understandable way, without depending solely on technical measurements. Its greatest advantage is that it translates wind speeds into visible effects on the environment, allowing its strength to be estimated even without specialized instruments.
Among its most common uses, the following stand out:
- Maritime navigation: sailors and fishermen use it to assess sea conditions before setting sail or during the voyage. Each level of the scale indicates how the waves will behave and whether it is safe to continue surfing.
- Meteorology: meteorological services use the scale to communicate the strength of the wind in reports and forecasts, making it easier for the population to better understand the information without needing to know the exact values in kilometers per hour.
- Outdoor activities: It is also useful for athletes, hikers or drone pilots, as it helps determine if conditions are suitable or too windy for an activity.

How does the Beaufort scale work?
The Beaufort scale works by assigning a number from 0 to 12 according to the wind speed measured in knots (1 knot is approximately equivalent to 1.85 km/h) and the visible effects that this wind produces on the sea or on land. Let’s look in more detail at each of the levels from 0 to 12, their speeds and the most notable features:
- 0. Calm (< 1 knot): There is no wind and the water behaves like a mirror.
- 1. Wind (1–3 knots): The wind is barely noticeable. The smoke moves slightly, but the vanes barely react. Small ripples without foam form in the sea.
- 2. Very light breeze (4–6 knots): It is felt on the face and gently moves the leaves of the trees. At sea, the waves are small and do not break yet.
- 3. Light breeze (7–10 knots): The leaves and small branches are in continuous movement. Small waves with crests appear in the sea and begin to whiten.
- 4. Moderate breeze (11–16 knots): Wind stirs up dust and loose papers; the thinnest branches move. At sea, waves become larger and crests become more frequent.
- 5. Cool breeze (17–21 knots): The wind moves small trees and some resistance may be felt when walking against it. At sea, the waves increase in size and spray begins to form.
- 6. Strong breeze (22–27 knots): Large branches sway and umbrellas or awnings may move strongly. At sea, the waves become large and the crests spread in the form of foam.
- 7. Strong wind (28–33 knots): The trees are completely shaken and it is difficult to walk against the wind. At sea, very large waves are formed with foam that is carried in the direction of the wind.
- 8. Moderate storm (34–40 knots): Branches can break and walking becomes very complicated. At sea, the waves are high and the crests break strongly, generating abundant foam.
- 9. Strong storm (41–47 knots): Minor damage occurs to buildings and trees. At sea, the waves reach great heights and the spray reduces visibility.
- 10. Rough storms (48–55 knots): Wind causes considerable damage to structures and trees. At sea, the waves are very big and white crests are seen everywhere.
- 11. Very harsh storms (56–63 knots): The wind causes significant damage. At sea, waves reach impressive heights, with crests breaking violently and foam covering much of the surface.
- 12. Hurricane (64 knots or more): The wind reaches its maximum intensity, with widespread destruction. At sea, the waves are enormous and the air is full of foam and spray, making visibility almost impossible. Here you can read about Hurricanes: what they are, how they are formed and categories.
What is the Beaufort scale table like?
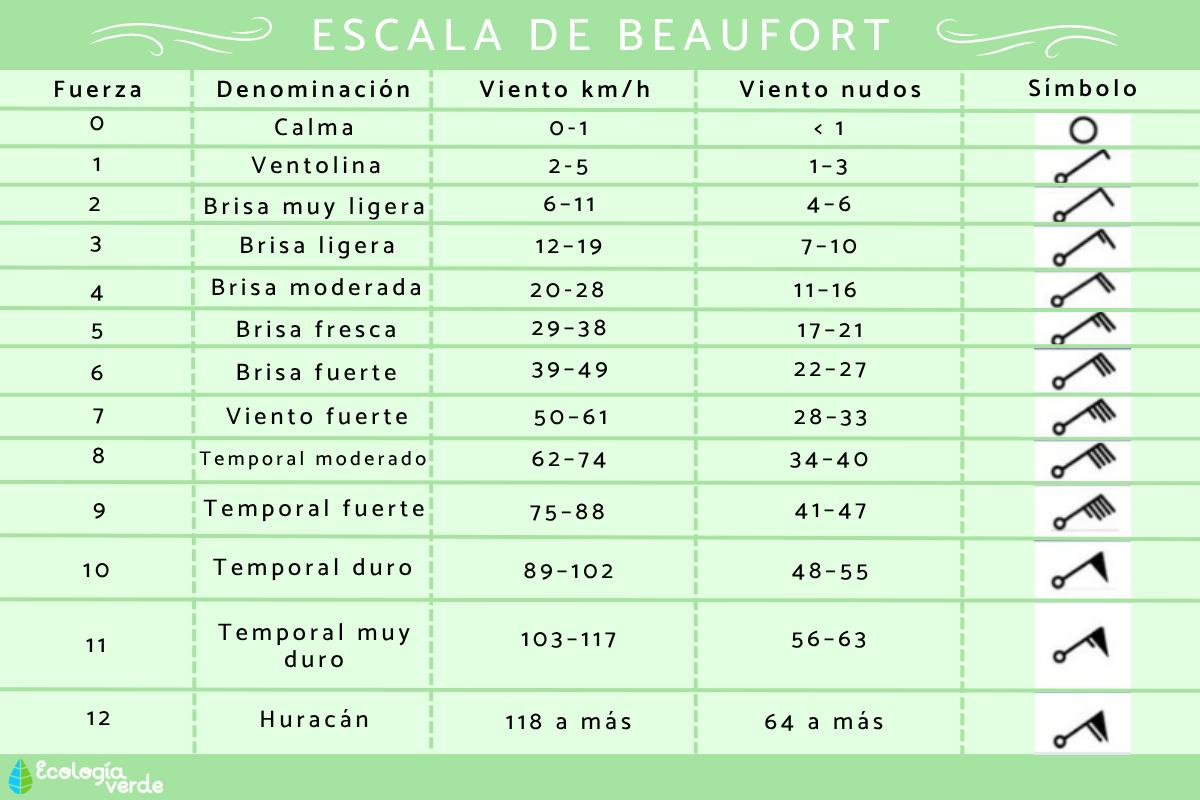
The table shows the levels of the Beaufort scale, ranging from 0 to 12, along with the name of the wind, its speed in kilometers per hour (km/h) and in knots, as well as the symbols used to understand the observable effects at sea.
Each level indicates a range of wind speed and describes how the sea surface changes as the intensity increases. For example, level 0 (Calm) represents a completely smooth sea, while level 12 (Temporary Hurricane) corresponds to an extremely strong wind that generates huge waves and foam in the air.
The symbols help to visually identify the strength of the wind on weather maps, and designations such as “Ventolina” or “Temporal strong” facilitate their practical use in navigation and meteorology. The table allows wind speed to be related to its visible effects, offering a clear reference to evaluate maritime and atmospheric conditions.

What is the difference between the Beaufort scale and the anemometer?
The main difference between the Beaufort scale and the anemometer is in how the wind is measured and the type of information they offer.
The Beaufort scale is a method of visual observation. It does not require instruments, but is based on the effects that the wind produces on the sea, trees, smoke or objects. For example, if the leaves move smoothly, a level 2 or 3 can be estimated; If the trees bend and it is difficult to walk, it may be a level 7 or higher. It is a qualitative form, that is, it describes what is seen.
The anemometer, on the other hand, is a measuring instrument that calculates the exact speed of the wind in units such as knots, kilometers per hour or meters per second. It can have different shapes (cup, propeller or ultrasonic), but they all work with the same objective, which is to obtain a precise numerical value.
In this other article you can learn more about the Anemometer: what it is, what it is for and how it works.
If you want to read more articles similar to Beaufort Scale: what it is, what it is for and table, we recommend that you enter our Meteorological Phenomena category.
- The Beaufort Wind Scale. Met Matters. Royal Meteorological Society. Available at: https://www.rmets.org/metmatters/beaufort-wind-scale
- The Beaufort Wind Scale: It’s History and Purpose. Classic sailing. Available at: https://classic-sailing.com/article/the-history-and-purpose-of-the-beaufort-wind-scale/